From Views to Clicks: How to Predict Ad performance Using AI Attention Heatmaps

In an era where milliseconds determine whether your creative connects or disappears, visual attention is no longer a guessing game, it’s a data science. Today’s marketing leaders need more than instinct. They need intelligence. That’s where AI attention heatmaps come in.
This blog post explores how marketing teams can use visual attention modeling to predict image performance before launching any campaign and how Socialtrait’s AI-powered Attention Heatmap tool makes that process real-time, scalable, and precise.
A common challenge in digital marketing is ensuring your visual content actually captures and holds your audience’s attention before launching live campaigns. Teams also need to know how well their creatives perform against industry benchmarks and evolving consumer behavior.
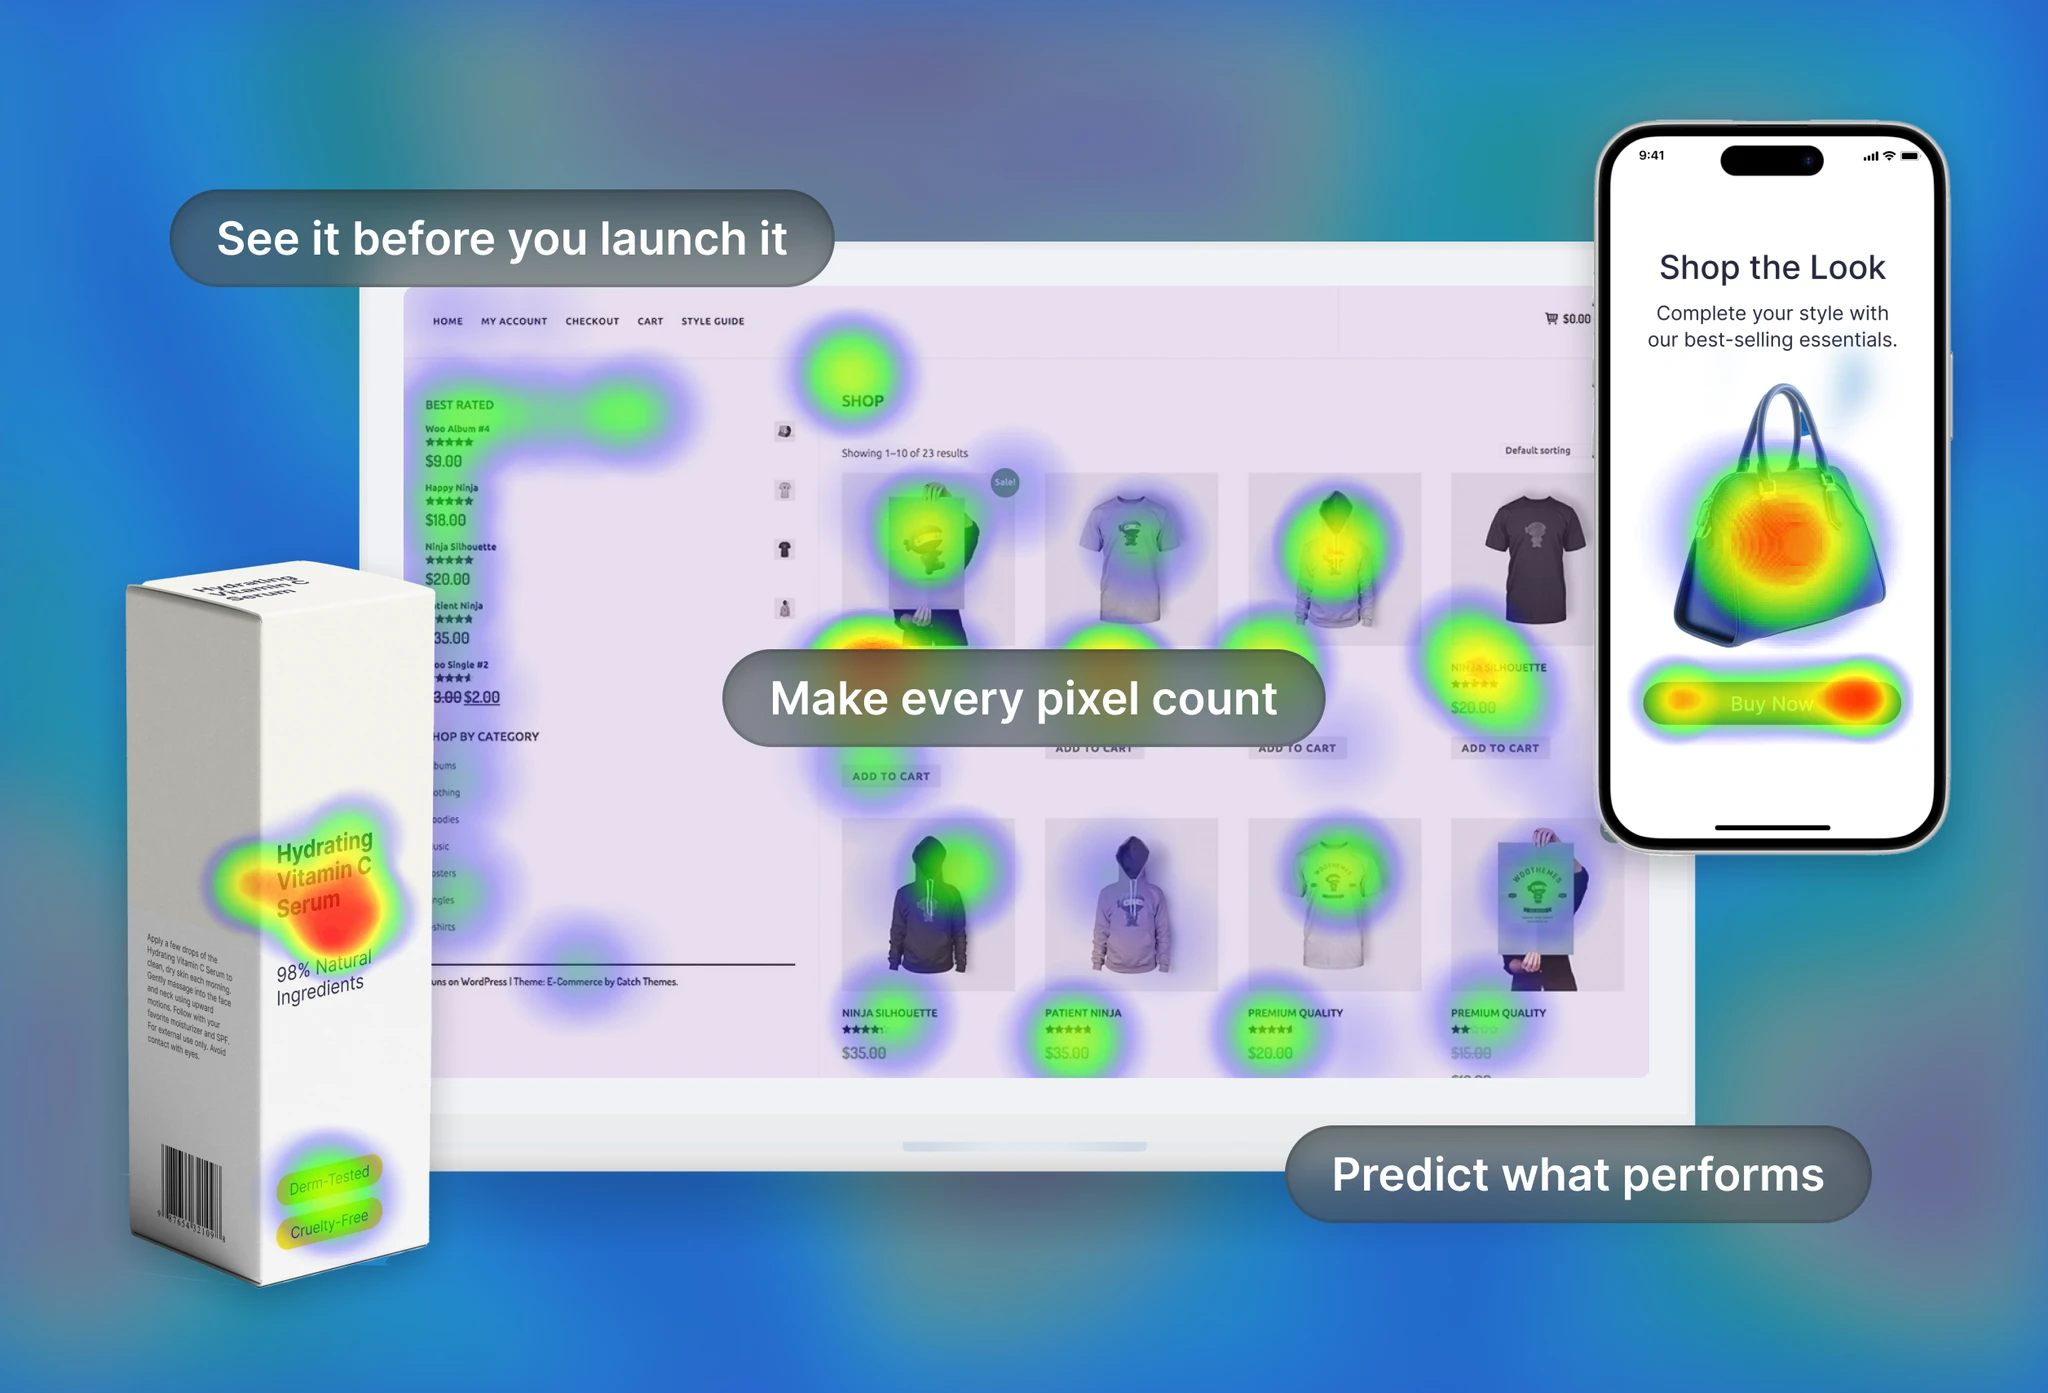
Heatmaps offer a fast, visual solution to this problem. These graphical representations use color gradients from cool blues to hot reds to show levels of attention or engagement. Traditionally applied in web and UX design, heatmaps have evolved into powerful tools for visual engagement testing.
When used in image testing, AI-powered attention heatmaps simulate how real consumers are likely to process content. They reveal focal points, gaze paths, and areas of disengagement—providing actionable insights before you go live.
In a saturated digital landscape, attention has become the most valuable (and volatile) currency. Every brand fights for a fraction of a second. Winning it means understanding what the consumer sees—first, fast, and most frequently.
Yet, many creative decisions are still based on intuition. That’s a risk modern CMOs can’t afford.
By accurately predicting where eyes will land and where they won’t, marketers gain a competitive edge. From design optimization for ads to improving conversion rates, seeing your creative through the customer’s eyes transforms performance from guesswork into science.
While traditional eye-tracking research delivers valuable insights, it often struggles to meet the speed, scale, and flexibility required by modern marketing teams.
- High Cost and Operational Complexity
Traditional eye-tracking setups require specialized hardware, lab environments, and physical participant panels, driving up both costs and logistical overhead. - Limited Scalability
Testing multiple assets or running iterative versions across segments becomes time-consuming and resource-intensive, making agile, iterative testing nearly impossible. - Lack of Accuracy
While traditional eye-tracking offers precision at the individual level, it does so at the cost of reach. Testing multiple creatives across multiple segments is rarely feasible. - Limited Sample Coverage
With traditional methods, you're typically testing with a handful of participants. That means insights are based on small, often non-representative groups—making it hard to generalize findings across demographics or audience segments.
These constraints have created demand for eye-tracking alternatives that deliver speed without sacrificing precision.
AI attention heatmaps are advanced tools that use machine learning to simulate human visual behavior. Trained on millions of eye-tracking data points, these models predict where viewers will focus, no labs, no cameras, no delays.
How they work:
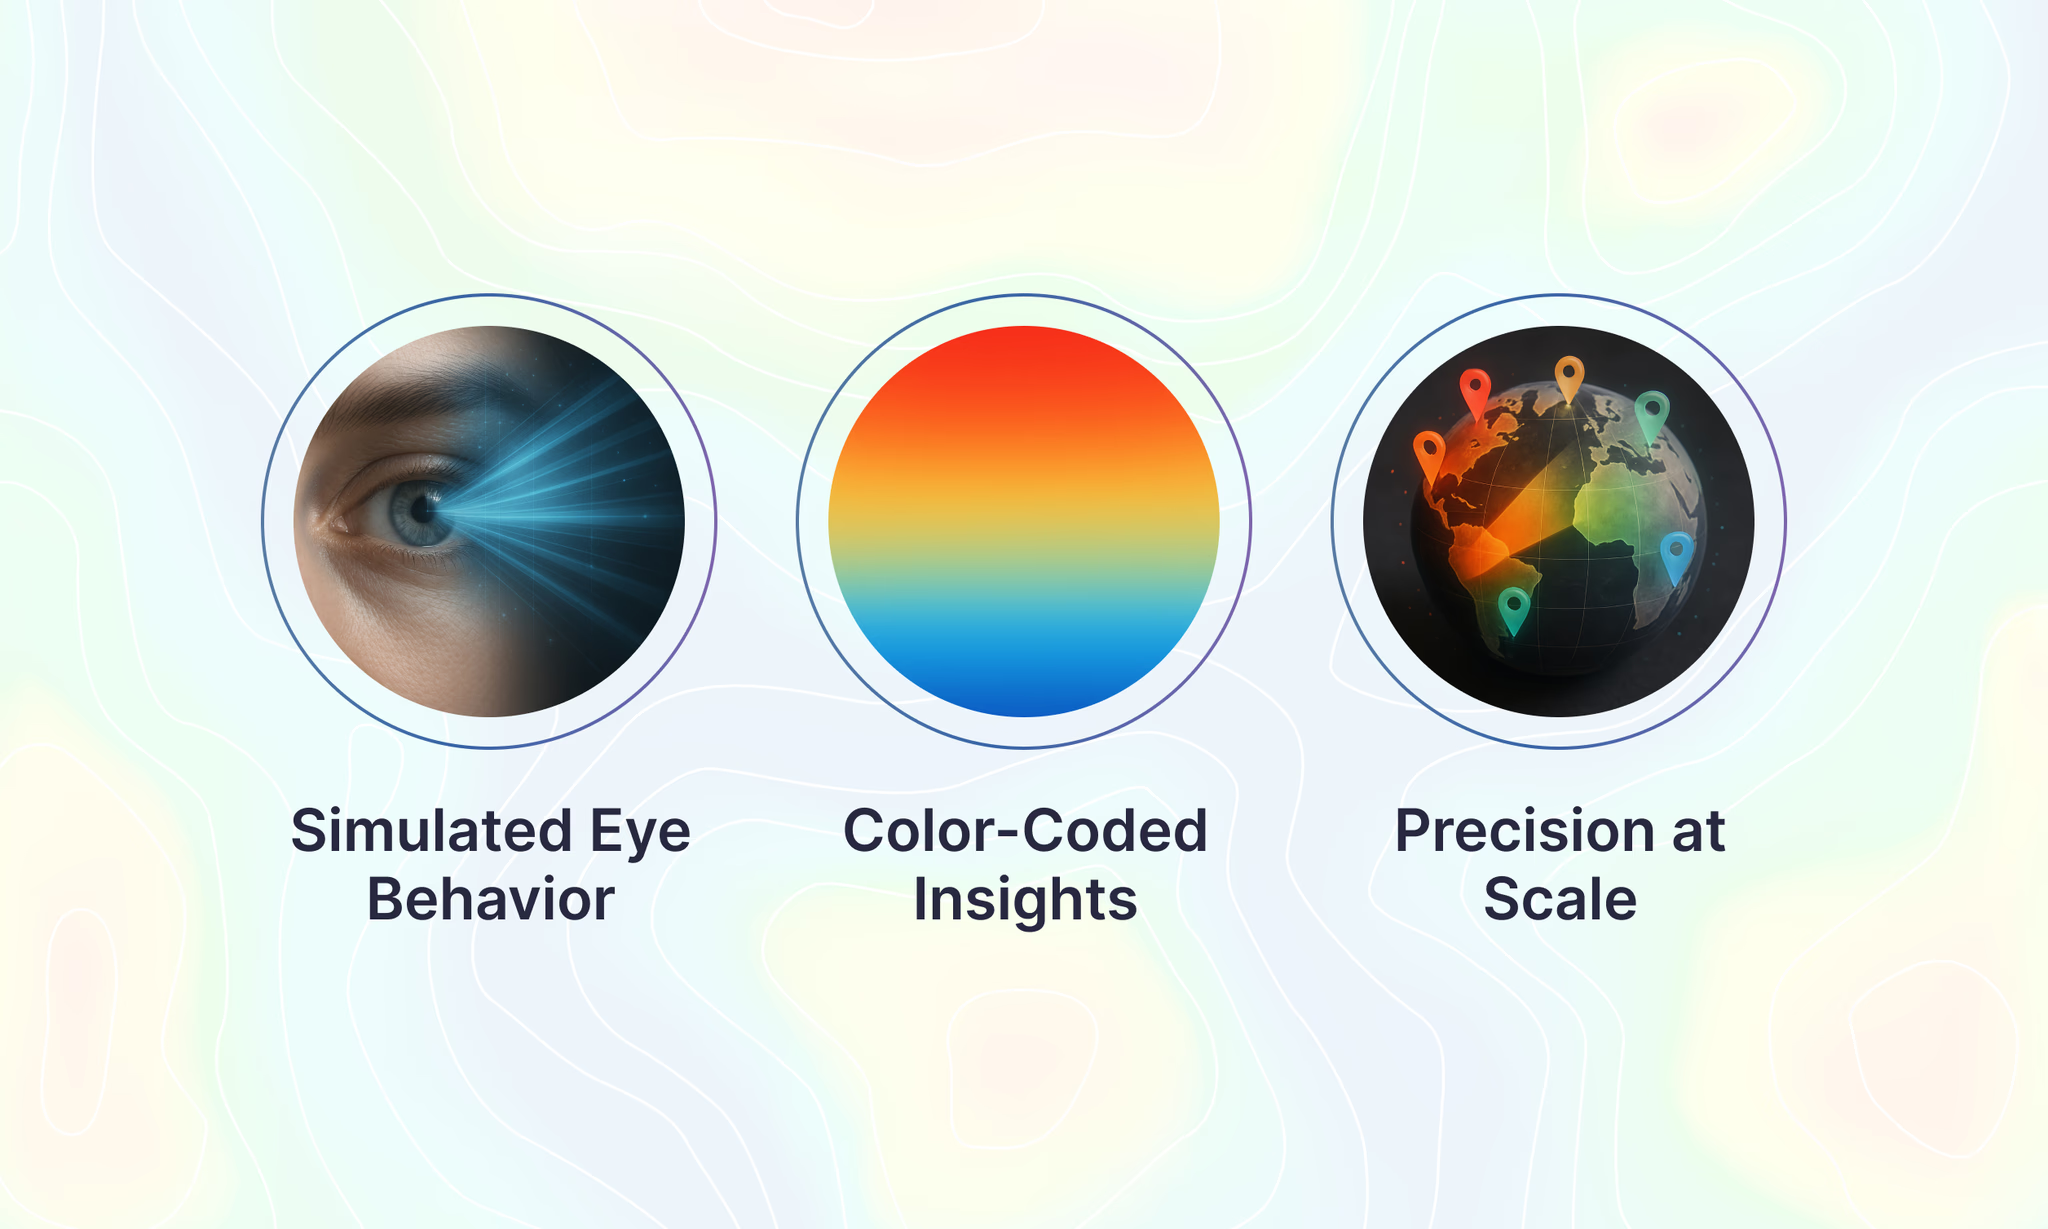
- Simulated Eye Behavior
Using AI, the system mimics human eye movement to generate Saliency Maps that highlight the “hot” and “cold” areas of your visual content. - Color-Coded Insights
The heatmap uses colors to highlight engagement. Warmer colors (like red and orange) mark high-attention zones, while cooler tones (like blue and green) show less focus. - Precision at Scale
Get instant visual insights across any audience segment—by age, interest, or location—so you can optimize faster and with confidence.
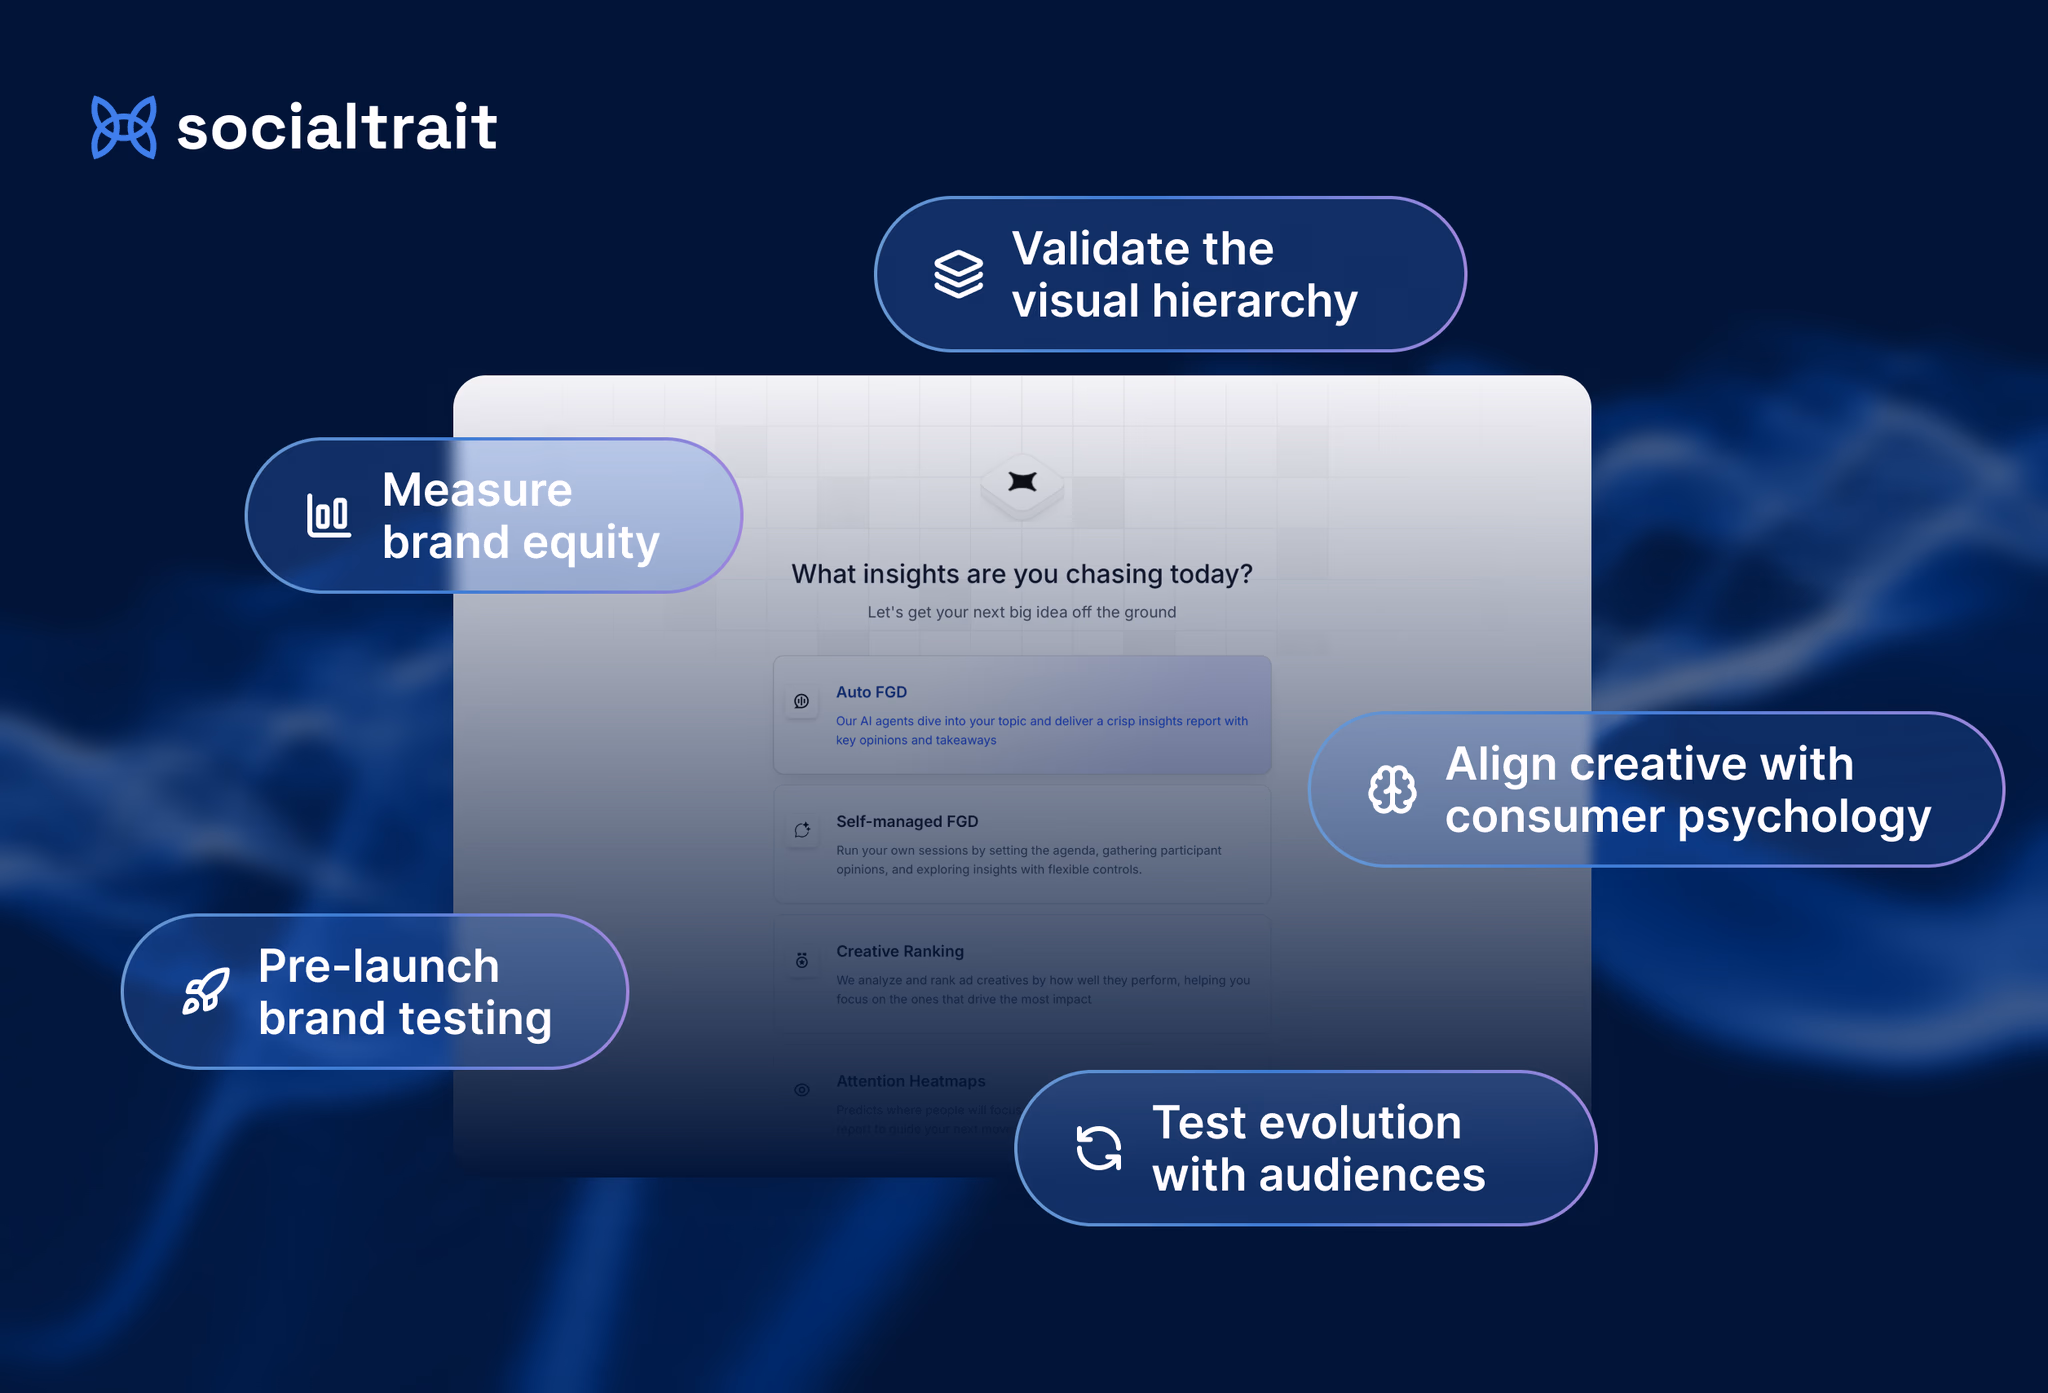
Socialtrait’s Attention Heatmap tool redefines how marketing and design teams predict and optimize creative performance.
- Attention Percentage Capability
Understand the proportion of attention each section receives within a visual. This helps identify which areas stand out most and which are overlooked—critical for refining layout and messaging hierarchy. - Gaze Sequence
See the order in which viewers are likely to scan your design. This helps you ensure that the most important elements—like logos, CTAs, or product highlights—are seen in the right sequence. - Omnichannel Creative Testing
Test your visuals across channels like digital ads, retail displays, and packaging. Socialtrait shows you where people focus, so your creative works better everywhere. - Instant Upload, Instant Results — Upload an image. Within seconds, receive a heatmap that reveals where attention is likely to focus.
- No Hardware or Human Panels — Bypass labs and participant logistics—Socialtrait delivers fully simulated, data-rich outputs.
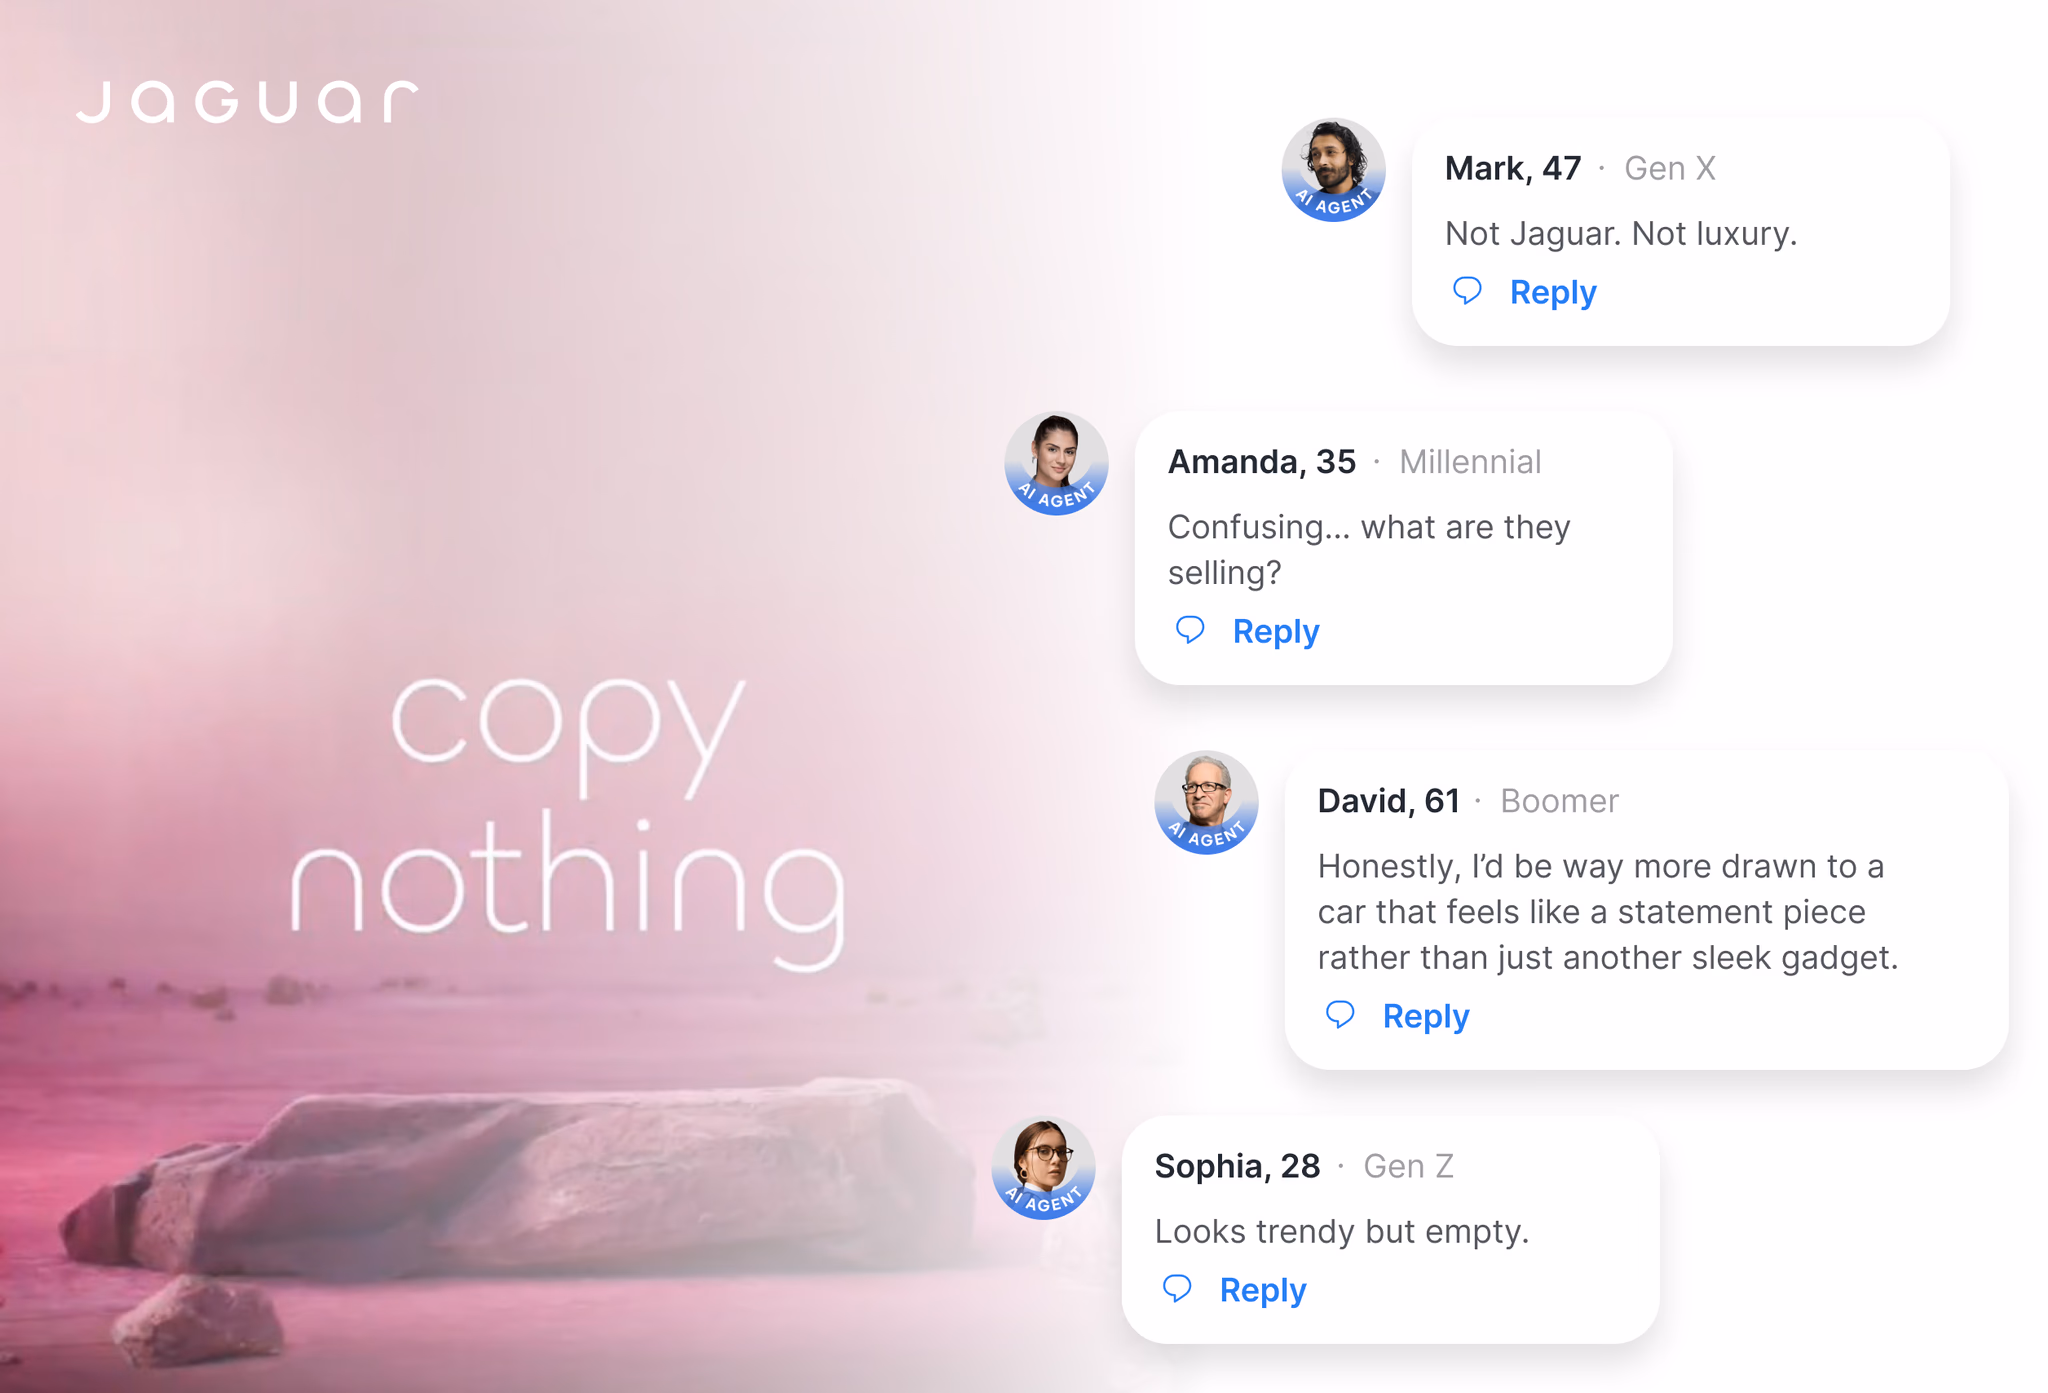
- AI Trained on Real Behavior — Modeled after actual consumer attention data, not artificial assumptions.
- Segment-Specific Predictions — Drill down by age, psychographics, or region to optimize for your precise target audience.
With Socialtrait, creative teams can test, learn, and adapt in real-time, reducing risk and improving ROI.
Related blogs


Level 3, 102 Victoria St, Carlton VIC 3053 Australia
1 Denison St Level 16, North Sydney, NSW 2060, Australia
95 Third Street, 2nd Floor, San Francisco, CA 94103